
Winning Result in March as Clouds Darken

Highlights
- The overall economy has been not great but ok in recent quarters, and the same could probably be said of the AV Sales Index too (AVI-S). That’s actually an unusual combination: Typically, our industry comfortably outperforms the wider economy. Based on the economic signals we’ve gotten so far this year, we would expect the AVI-S to be probably in the upper 50s or even 60; meanwhile, it’s languished in the low 50s. That is understandable given the transitions out of the pandemic, but it is disappointing. However, now there’s good news: The AVI-S leapt from 54.0 in February to 60.9 for March! This is very welcome positivity, though we should not expect it to continue. A substantial change in any direction that is unaccompanied by a clear cause usually reverts in the following month, and that’s what we anticipate here: Back to mid or low 50s. That’s especially true given the intensity of trade conflict that is heating up between the U.S. and the rest of the world. Tariffs (and their related uncertainty) were by far the top concern in the open-ended comments from our response pool—and that’s with almost the entire sampling period before President Trump’s April 2nd tariff announcement.
President Trump’s April 2nd announcement of massive tariffs on countries all around the world are a clear source of short-term pain for our industry. Perhaps there is a long-term strategy that will pay off, but for now, they are a big negative. The announcements imposed two forms of tariffs: A flat 10% on all imports, plus “reciprocal” tariffs on 57 countries that are calculated as a function of the U.S.’s trade deficit for goods. This is a dramatic intensification of the tariff steps he has taken so far, and will drive prices higher in the U.S. In addition, the scale of the attack on free trade is a major negative for the economy overall. So far, our coverage has generally focused on tariffs as a source of difficulty for the channel—prices changing, sourcing changing—rather than as a cause for reduced total demand. These new tariffs alter that equation. Recession odds for 2025 in the U.S. have climbed well over 50%, and equity markets experienced their worst day since 2020, which was then followed by an even worse day. The path forward remains uncertain—Trump could easily alter his plans and restore some of the lost strength—but for now, the outlook is negative.
- The AV Employment Index (AVI-E) was a clear contrast to the AVI-S in March. After running ahead of the AVI-S so far this year (suggesting greater strength than the AVI-S was indicating), the AVI-E decelerated in March to 53.5. In previous months, the AVI-E was a reassuring counterpoint to a disappointing AVI-S; now it’s a splash of cold water on an exciting AVI-S. Taking the whole first quarter’s data together, the AVI-S and AVI-E tell a story of an industry growing modestly. The growth is below historical rates but still meaningful. In wider employment news, the U.S. had a good result for its March employment report. Payroll growth was at 228,000, well up from the 117,000 in February. It’s critical to note that this information is a valuable metric, but a lagged one. In a hypothetical where we enter a recession, we should expect jobs numbers to look ok for some months before the true impact of the downturn begins to show. That’s not to undermine the good news in March but rather to put in mind as we go forward in a world where a 2025 recession looks likely.
International Outlook
Surprising news! Here’s what happened: The gap between North America and the rest of the world had closed in our initial reading for February 2025. The rest of the world had outpaced North American growth for nearly two years in our index. But with the newly finalized numbers in our moving average for February, North America has exceeded the rest of the world, 55.4 to 55.2! It finally happened! Now in March, the numbers are back to “normal:” Rest of the world is again ahead of North America at 58.3 in the initial reading, with North America close behind at 57.1.1 Shared growth is the ideal for our industry, so it’s nice to see both regions expanding at close levels, with the leading grow changing from month-to-month. Here’s hoping that lasts!
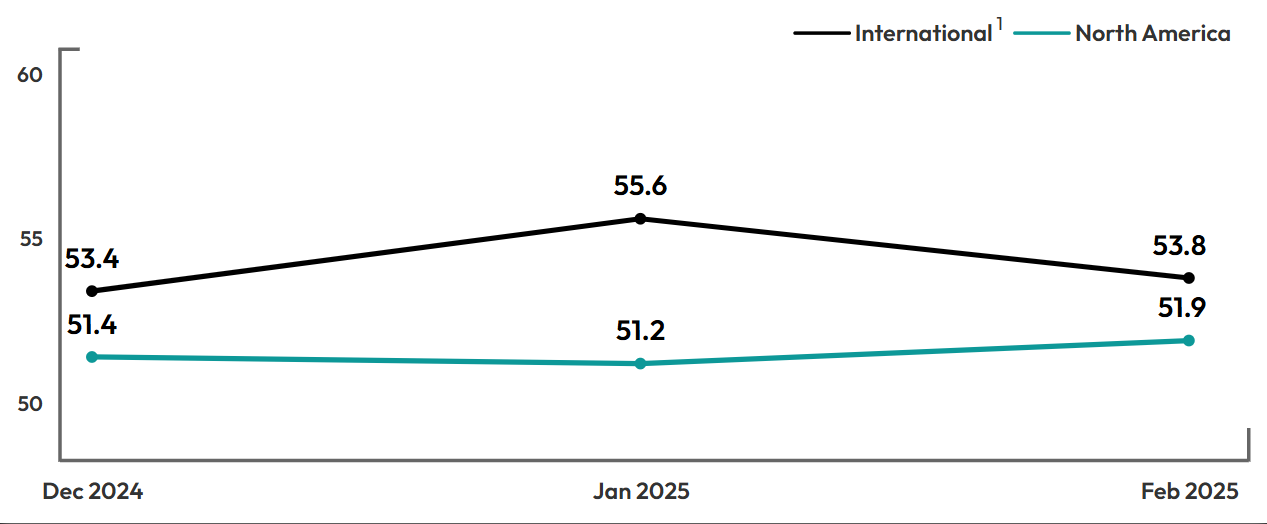
1Due to the small sample, the North American and International indexes are based on a 3-month moving average. The March 2025 index is preliminary, based on the average of February and March 2025 and will be final with April 2025 data in the next report.
1AVIXA®, the Audiovisual and Integrated Experience Association, has published the monthly Pro AV Business Index since September 2016, gauging sales and employment indicators for the pro AV industry. The index is calculated from a monthly survey that tracks trends. Two diffusion indexes are created using the survey: the AV Sales Index (AVI-S) and AV Employment Index (AVI-E). The diffusion indexes are calculated based on the positive response frequency from those who indicated their business had a 5% or more increase in billings/sales from the prior month plus half of the neutral response. An index of 50 indicates firms saw no increase or decline in business activity; more than 50 indicates an increase, while less than 50 indicates a decrease.
Huge Spring Annual Event is coming up, all hands on deck gearing for preparations. Meeting quantities increase significantly. Very busy in the late March and beginning of April.
AV Integrator, North America
Q1 is typically our low point in the year. While ISE is a great tradeshow, it can be a big distraction and impact business for several weeks prior and afterward. InfoComm is getting closer which can spur business
AV Provider, North America
Tariff policies carry uncertainty like all other contractors. No significant internal changes.”
Av Integrator, APAC
Methodology
The survey behind the AVIXA Pro AV Business Index was fielded to 2,000 members of the AVIXA Insights Community between March 28 2025, and April, 2025. A total of 278 AV professionals completed the survey. Only respondents who are service providers and said they were “moderately” to “extremely” familiar with their company’s business conditions were factored in index calculations. The AV Sales and AV Employment Indexes are computed as diffusion indexes. The monthly score is calculated as the percentage of firms reporting a significant increase plus half the percentage of firms reporting no change. Comparisons are always made to the previous month. Diffusion indexes, typically centered at a score of 50, are used frequently to measure change in economic activity. If an equal share of firms reports an increase as reports a decrease, the score for that month will be 50. A score higher than 50 indicates that firms, in the aggregate, are reporting an increase in activity that month compared to the previous month. In contrast, a score lower than 50 is a decrease in activity.
About the AVIXA Insights Community
The AVIXA AV Intelligence Panel (AVIP) is now part of AVIXA’s Insights Community, a research group of industry volunteers willing to share their insights on a regular basis to create actionable information. Members of the community are asked to participate in a short, two-to-three-minute monthly survey designed to gauge business sentiment and trends in the AV industry. Community members will also have the opportunity to participate in discussions, polls and surveys.
Community members will be eligible to:
- Earn points toward online gift cards
- Receive free copies of selected market research
- Engage directly with AVIXA's market intelligence team to help guide research
- Ask and answer other industry professionals' questions
The Insights Community is designed to be a global group, representative of the entire commercial AV value chain. AVIXA invites AV integrators, consultants, manufacturers, distributors, resellers, live events professionals, and AV technology managers to get involved. If you would like to join the community, enjoy benefits, and share your insights with the AV industry, please apply here